The Weather app on the Apple Mac shows more than the current weather and forecast, it shows historical weather data, like the average rainfall or temperature for an area, month and year.
Sometimes the weather seems bad, but how bad is it really? Is it worse than previous years? Is it really the most rainfall we have ever had or the highest temperature, or was it worse in the past? The macOS Weather app can tell you whether the current conditions are above or below average.
It can be interesting to see how rainfall and temperature changes over the year and seeing when it is the warmest or the wettest can help you plan trips. You don’t want to visit somewhere when it is raining or when it is freezing cold or unbearably hot. Knowing the average rainfall and temperature can help you to plan trips and holidays.
Suppose you want to visit Yellowstone National Park. Some people would say that it is great at any time of the year, but suppose you want to go when it is warm and dry, rather than cold and wet. For this you need the latest version of macOS and the Weather app on your Mac.
Related: How to recover space used by macOS Sonoma video wallpapers
Get a weather forecast
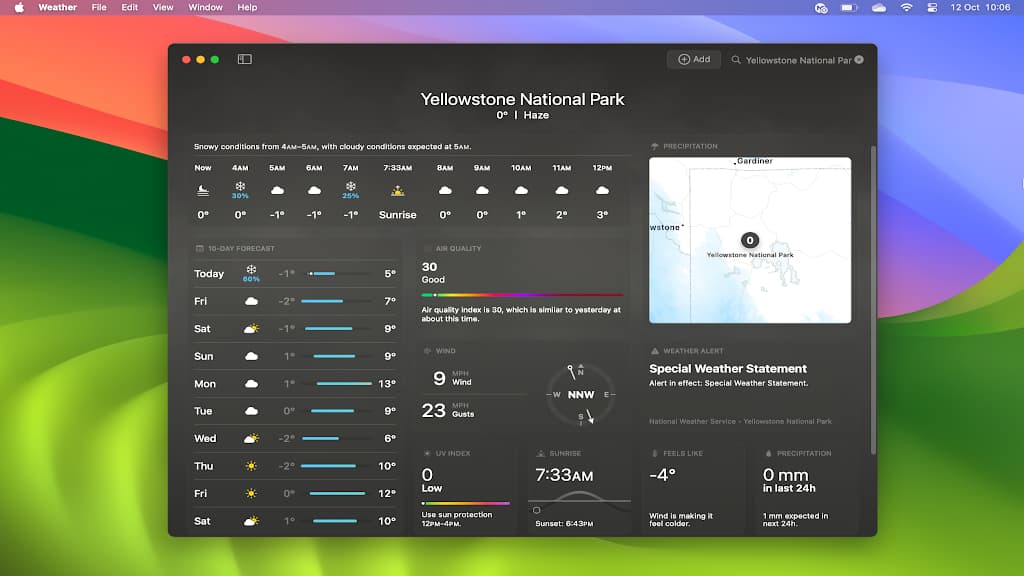
Open the Weather app on your Mac and enter the location into the search box in the top right corner of thew window. A screen packed with current weather information is displayed. This is useful if you are already there or are close enough for a day trip, but suppose you are planning a trip some time in the future and you want to know the best time to go.
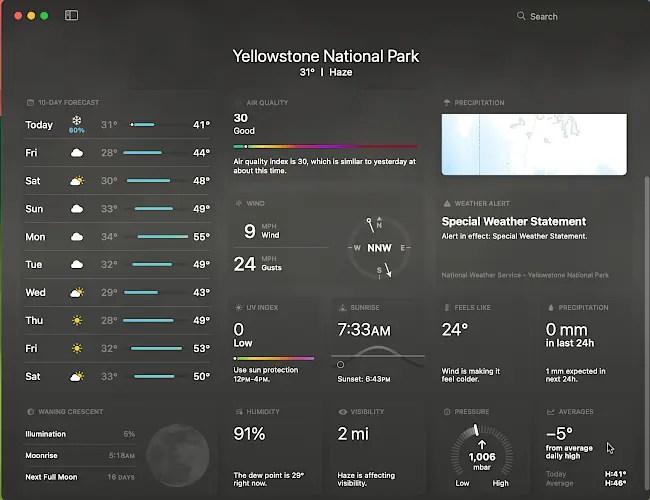
In the bottom right corner of the window it says -5 degrees. That is not the temperature, it is the deviation from the average for this time of year. (Choose Fahrenheit or Celsius in the Weather app settings as you prefer.)
See average temperatures
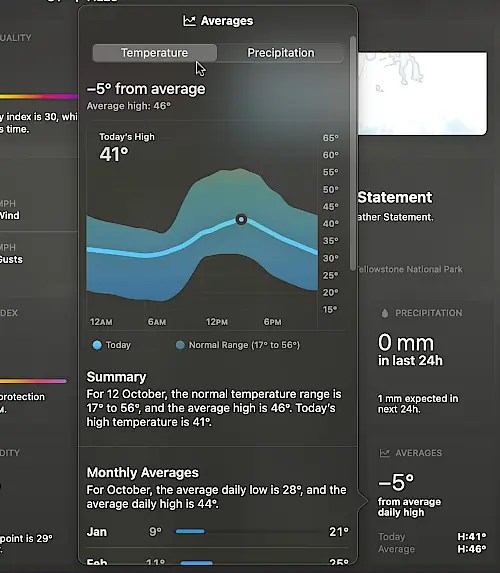
Click the tile in the bottom right corner to display the Averages panel. The light blue line is the temperature and the darker blue indicates the range of temperatures that have been seen in the past on this day.
You can see that today’s high is 41 degrees, which is 5 degrees below the average of 46 degrees. Move the mouse over the chart to see the data change over time.
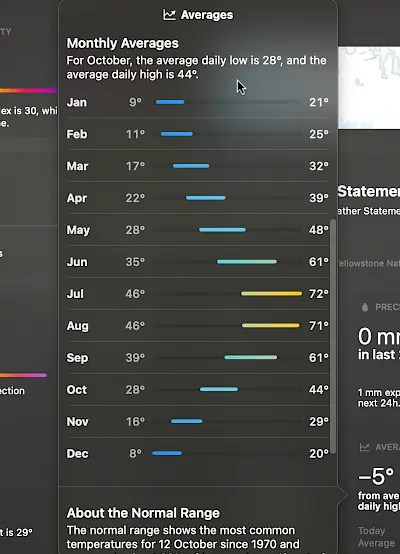
Scroll the panel and the temperature range for each month of the year is displayed. You can clearly see that the warmest months to visit are July and August.
See average rainfall
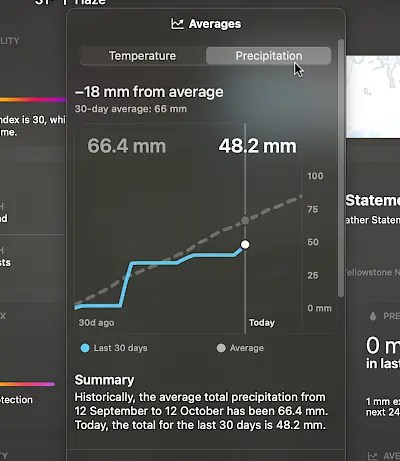
Select the Precipitation tab in this panel and the average rainfall is displayed for the last 30 days. The grey dashed line shows the average and the last 30 days is shown as a blue line. You can see in this chart that there has been less rainfall than usual for this time of year, 18 mm below average in fact.
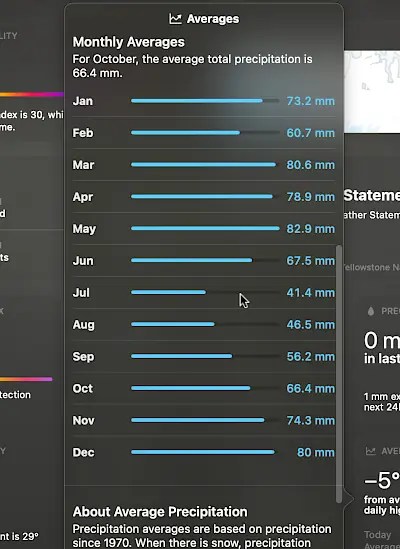
Scroll the panel and the average rainfall for each month of the year is displayed. You can see which months are wettest and driest. If you were planning a trip, you might want to go in July or August as these have the least rainfall. March to May are very rainy.
The historic rainfall and temperature data covers the last 50 years and it can put today’s weather into perspective. You can see whether it is worse or better than average. Historic data can also be useful for planning trips. It is impossible to predict the weather months in advance, but knowing the average temperature and rainfall for somewhere you plan to visit can be very useful.
